space-ml-lab · Project P1 · Technical report
Recovery of the Open Cluster NGC 2516 in Gaia DR3 by Unsupervised Density-Based Clustering
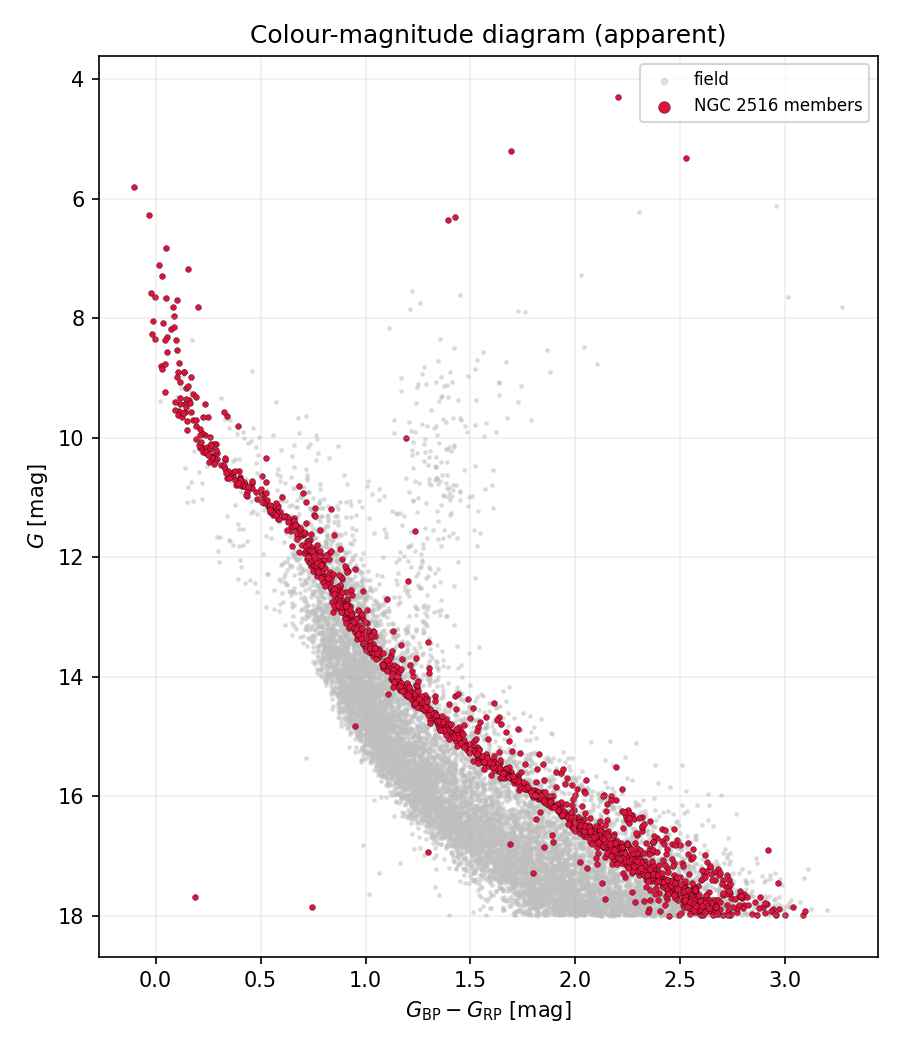
We present a fully local, reproducible pipeline that retrieves real astrometric and photometric data from the Gaia Data Release 3 (DR3) catalogue and searches for stellar over-densities in a five-dimensional kinematic-plus-parallax feature space using density-based clustering. Applied to a cone of radius $2.0^\circ$ centred on the well-studied southern open cluster NGC 2516, the pipeline retrieves $N=13{,}537$ sources after astrometric quality cuts and identifies two over-densities with HDBSCAN, assigning $53.6\%$ of sources to a diffuse field (noise) component. The dominant compact structure is recovered as $1{,}618$ candidate members with median proper motion $(\mu_{\alpha^\ast},\mu_\delta)=(-4.652\pm0.528,\,11.211\pm0.437)\ \mathrm{mas\,yr^{-1}}$ and median parallax $\varpi=2.429\pm0.050\ \mathrm{mas}$ (distance $411.6\ \mathrm{pc}$). A positional cross-match against the Hunt & Reffert (2023) all-sky catalogue (VizieR J/A+A/673/A114) identifies this structure as NGC 2516 at a separation of $0.017^\circ$ ($\approx1.0'$), with residuals $(\Delta\mu_{\alpha^\ast},\Delta\mu_\delta,\Delta\varpi)=(-0.019,-0.014,+0.002)$ — agreement at the level of tens of $\mu\mathrm{as\,yr^{-1}}$ and a few $\mu\mathrm{as}$. The members define a single narrow main sequence in the colour–magnitude diagram, independently confirming a genuine coeval population. This run validates the detector against a known object.
1. Introduction
Stars that form together in a gravitationally bound open cluster inherit a common bulk space motion and lie, to first order, at a common distance. In the space of Gaia observables — sky position $(\alpha,\delta)$, parallax $\varpi$, and proper motion $(\mu_{\alpha^\ast},\mu_\delta)$ — cluster members appear as a compact concentration while unrelated field stars form a smooth, diffuse background. This structural contrast makes cluster detection and member identification a natural application of unsupervised clustering.
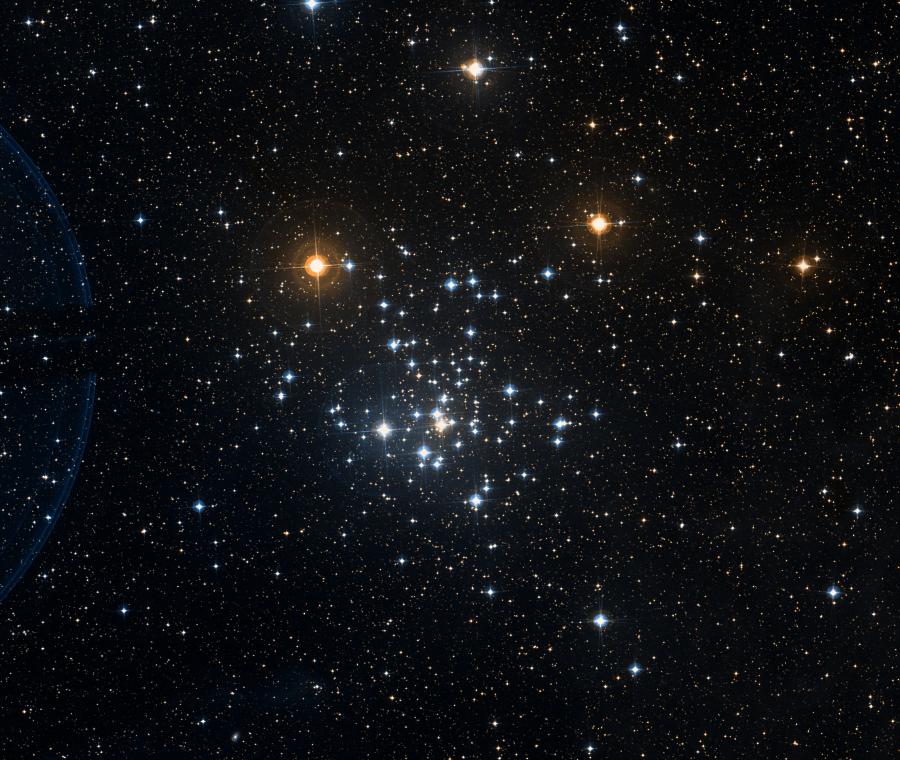
Density-based clustering is particularly well suited because (i) the number of clusters is not known a priori, (ii) the field population must be modelled as noise rather than forced into a cluster, and (iii) clusters may have arbitrary shapes and differing densities. We combine HDBSCAN with a two-dimensional UMAP embedding for visualisation, applied to a region centred on the benchmark cluster NGC 2516 (rich, nearby $\sim$410 pc, intermediate age $\sim$125–140 Myr). The aim of this run is validation: to demonstrate that the pipeline recovers a known cluster with astrometry consistent with the literature, before the same machinery is turned to less-studied regions in search of genuine candidates.
2. Data
Data were obtained from Gaia DR3 [1], table gaiadr3.gaia_source, through the official Gaia archive TAP endpoint using astroquery.gaia [6] with an asynchronous ADQL job. The query selects a $2.0^\circ$ cone centred on $(\alpha,\delta)=(119.517^\circ,-60.753^\circ)$ (the catalogued centre of NGC 2516) with:
parallax_over_error > 5     -- well-determined parallaxes
ruwe < 1.4                   -- reject poor astrometric solutions / unresolved binaries
phot_g_mean_mag < 18         -- magnitude limit for reliable astrometry
parallax BETWEEN 1.0 AND 4.0 -- bracket the cluster distance (~250-1000 pc)
The query returns 13,537 sources, cached to data/gaia_region.csv. All retrieved values are real; none are simulated.
3. Methods
3.1 Feature construction and standardisation
Each source is represented by the five-dimensional vector $\mathbf{x}_i=(\mu_{\alpha^\ast,i},\mu_{\delta,i},\varpi_i,\alpha_i,\delta_i)$. Because the features have heterogeneous units and dynamic ranges, each is standardised to zero mean and unit variance,
$$z_{ij}=\frac{x_{ij}-\bar{x}_j}{s_j},\qquad s_j=\sqrt{\tfrac{1}{N}\sum_i (x_{ij}-\bar{x}_j)^2},$$so that the Euclidean distances used downstream are not dominated by the wide-ranging sky coordinates.
3.2 Density-based clustering: HDBSCAN
Clustering is performed on the standardised 5-D features with HDBSCAN [3][4]. For a neighbourhood size $k$ (min_samples) the core distance of a point $a$ is the distance to its $k$-th nearest neighbour, $\mathrm{core}_k(a)=d(a,N_k(a))$. HDBSCAN re-weights pairwise distances by the mutual reachability distance
$$d_\mathrm{mreach}(a,b)=\max\big(\mathrm{core}_k(a),\,\mathrm{core}_k(b),\,d(a,b)\big),$$which leaves distances within dense regions unchanged while pushing low-density points apart. A minimum spanning tree of the mutual-reachability graph yields a hierarchy of connected components across all density thresholds; the hierarchy is condensed with a min_cluster_size constraint, and a flat clustering is extracted by maximising the total cluster stability $S(C)=\sum_{p\in C}(\lambda_p-\lambda_C)$ with $\lambda=1/d_\mathrm{mreach}$. Points in no selected cluster are labelled noise. We use min_cluster_size = 80, min_samples = 20, Euclidean metric, and the excess-of-mass selection method.
3.3 Dimensionality reduction: UMAP
For visualisation, a 2-D embedding is computed with UMAP [5]. UMAP builds a local fuzzy simplicial set for each point with membership decaying as $p_{j|i}=\exp\!\big(-\max(0,d(x_i,x_j)-\rho_i)/\sigma_i\big)$, symmetrises the memberships, and optimises a low-dimensional layout by minimising the fuzzy-set cross-entropy
$$\mathcal{C}=\sum_{i\neq j}\Big[p_{ij}\log\tfrac{p_{ij}}{q_{ij}}+(1-p_{ij})\log\tfrac{1-p_{ij}}{1-q_{ij}}\Big].$$We use n_neighbors=30, min_dist=0.0, random_state=42. Clustering is performed in the physical feature space; UMAP is used only for visualisation.
3.4 Identification and cross-validation
The HDBSCAN cluster whose median $(\mu_{\alpha^\ast},\mu_\delta,\varpi)$ is closest to the NGC 2516 literature value is designated the recovered cluster. Robust location/scale use the median and the MAD-based estimator $\hat{\sigma}=1.4826\times\operatorname{median}_i|x_i-\operatorname{median}(x)|$. The centroid is cross-matched by sky position against Hunt & Reffert (2023) [2] via VizieR.
4. Results
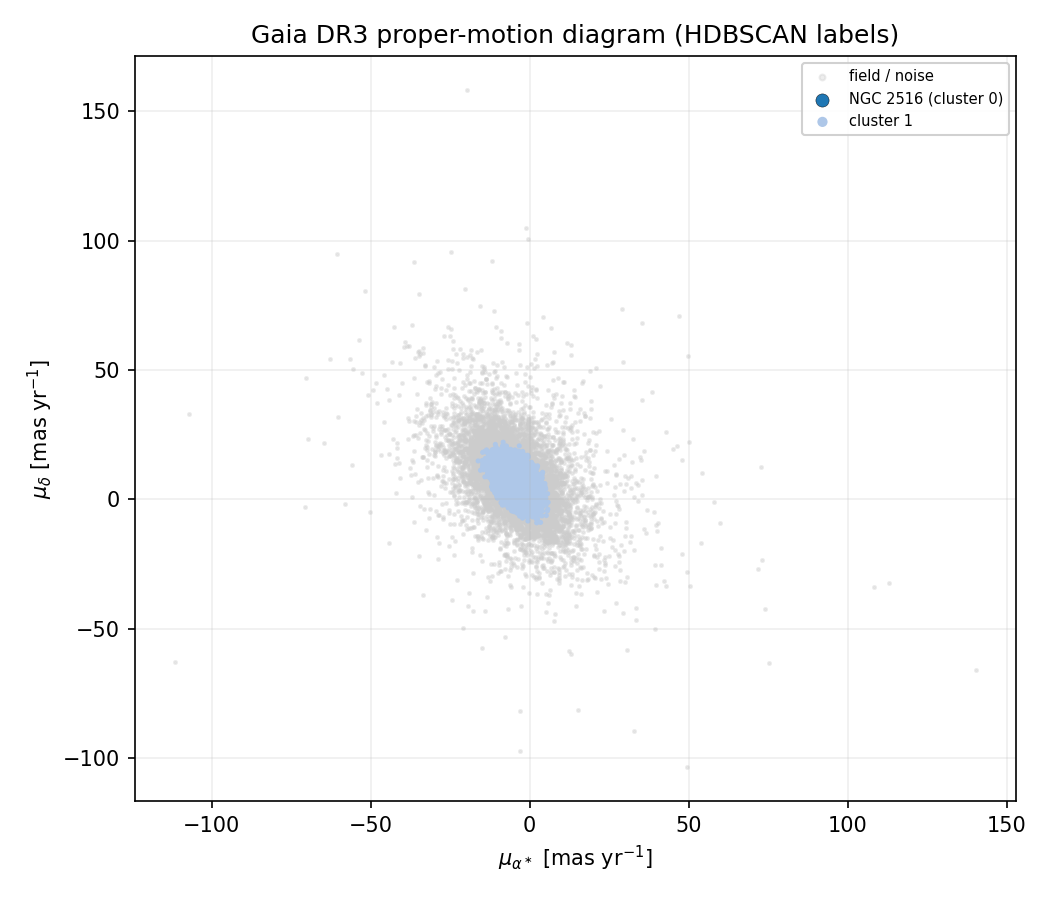
From the 13,537 sources HDBSCAN identifies 2 clusters and labels 7,258 ($53.6\%$) as noise — expected, since the diffuse field is correctly assigned to the background.
| Cluster | $N$ | $\mu_{\alpha^\ast}$ | $\mu_\delta$ | $\varpi$ (mas) | Distance |
|---|---|---|---|---|---|
| 0 (NGC 2516) | 1,618 | $-4.652$ | $11.211$ | $2.429$ | 411.6 pc |
| 1 (secondary) | 4,661 | $-4.331$ | $7.637$ | $1.176$ | $\sim$850 pc |
4.1 Recovery and validation
The dominant over-density comprises 1,618 members with robust astrometry $\mu_{\alpha^\ast}=-4.652\pm0.528$, $\mu_\delta=11.211\pm0.437\ \mathrm{mas\,yr^{-1}}$, and $\varpi=2.429\pm0.050\ \mathrm{mas}\Rightarrow d=411.6\ \mathrm{pc}$ (uncertainties are the intrinsic MAD dispersions, i.e. the physical spread of the cluster). The positional cross-match returns NGC 2516 at $0.017^\circ$ separation:
| Quantity | Measured | Literature (H&R 2023) | Residual (obs − lit) |
|---|---|---|---|
| $\mu_{\alpha^\ast}$ (mas yr⁻¹) | $-4.652$ | $-4.634$ | $-0.019$ |
| $\mu_\delta$ (mas yr⁻¹) | $11.211$ | $11.226$ | $-0.014$ |
| $\varpi$ (mas) | $2.429$ | $2.427$ | $+0.002$ |
The agreement is excellent — proper motions match at tens of $\mu\mathrm{as\,yr^{-1}}$ and the parallax at a few $\mu\mathrm{as}$, far below the intrinsic cluster dispersion.
4.2 The secondary over-density
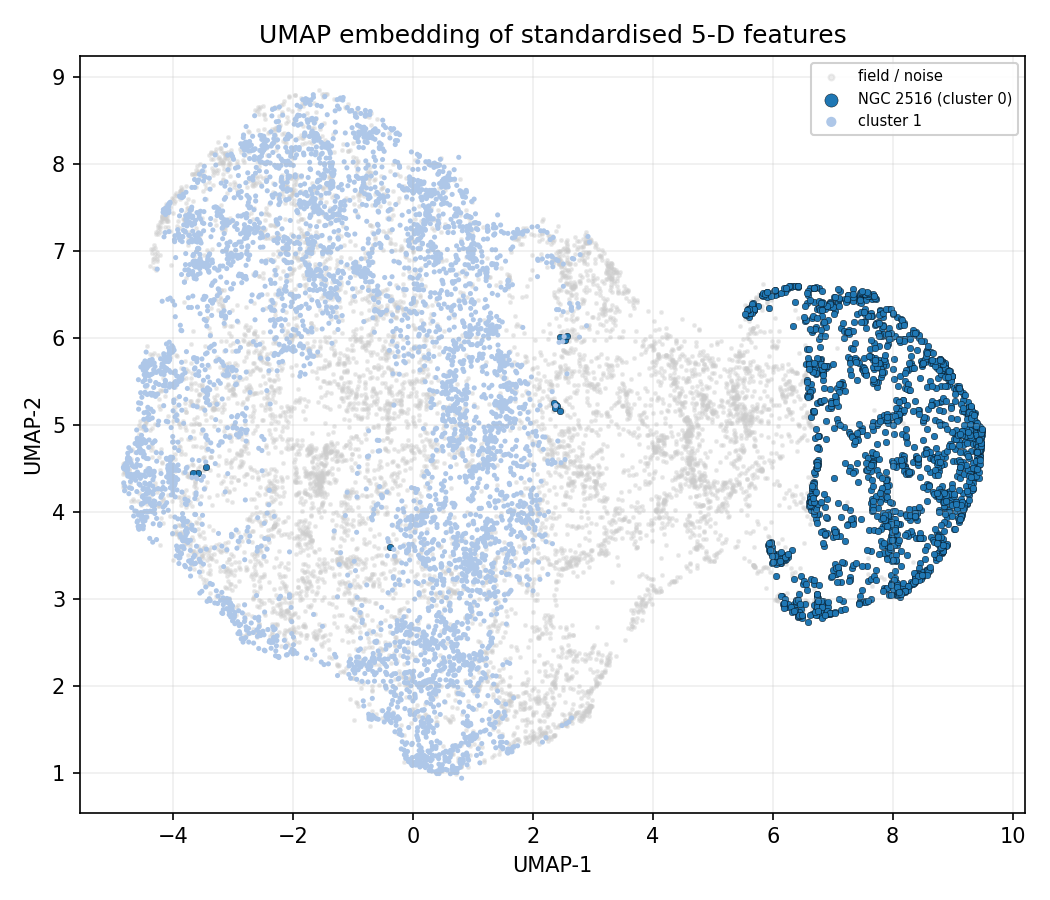
The second cluster (4,661 sources, $\sim$850 pc) is a diffuse concentration that overlaps the field in the UMAP embedding. It is not validated as a bona-fide cluster here; it most plausibly reflects a looser background/disc kinematic concentration within the parallax window and would require an independent CMD test and catalogue cross-match before any claim of physical reality. It is reported transparently as an unvalidated secondary structure.
5. Caveats
- Recovery, not discovery. The region was deliberately centred on a catalogued cluster; this validates the detector but is not a discovery. Genuine candidate searches require under-studied regions and systematic catalogue cross-matching.
- HDBSCAN parameter sensitivity. Cluster count and membership depend on min_cluster_size/min_samples; a robust analysis should scan a grid.
- Selection effects. The ADQL cuts bias against faint, distant, and astrometrically difficult members and truncate the fainter main sequence.
- Astrometric membership only. Field interlopers with similar kinematics can enter the member list; the CMD is an independent photometric check, not a formal membership probability.
6. Reproducibility
cd projects/p1-gaia-star-clusters
python3 src/cluster_search_local.py   # queries Gaia (cached), clusters, validates, writes figures
Outputs: outputs/{sky_pm,cmd,umap}.png, candidate_members.csv (1,618 members), run_summary.json. Results are deterministic across runs.
References
- Gaia Collaboration, Vallenari, A., et al. (2023). Gaia Data Release 3. A&A 674, A1. doi:10.1051/0004-6361/202243940.
- Hunt, E. L., & Reffert, S. (2023). Improving the open cluster census. II. An all-sky cluster catalogue with Gaia DR3. A&A 673, A114. doi:10.1051/0004-6361/202346285 (VizieR J/A+A/673/A114).
- Campello, R. J. G. B., Moulavi, D., & Sander, J. (2013). Density-Based Clustering Based on Hierarchical Density Estimates. PAKDD 2013, LNCS 7819, 160–172. doi:10.1007/978-3-642-37456-2_14.
- McInnes, L., Healy, J., & Astels, S. (2017). hdbscan: Hierarchical density based clustering. JOSS 2(11), 205. doi:10.21105/joss.00205.
- McInnes, L., Healy, J., & Melville, J. (2018). UMAP: Uniform Manifold Approximation and Projection. arXiv:1802.03426.
- Ginsburg, A., Sipőcz, B. M., Brasseur, C. E., et al. (2019). astroquery. AJ 157, 98. doi:10.3847/1538-3881/aafc33.
- Cantat-Gaudin, T., et al. (2020). Painting a portrait of the Galactic disc with its stellar clusters. A&A 640, A1. doi:10.1051/0004-6361/202038192.